Insights · October 2026
Where in the capital stack are you actually sitting?
National dwelling values fell 3.7% over the September quarter and the median capital city sale now takes 39 days instead of 23. Both numbers land on credit investors before they land on anybody else, and where they land depends entirely on your ranking.

Cathy Howard · Skyring Asset Management · 18 October 2026
General information only. Read the PDS before investing. AFSL 422902.

Two Australian credit funds can lend into the same suburb, against the same kind of asset, to borrowers of similar quality, and pay rates several hundred basis points apart. Both describe their lending as secured against residential development property. Both are telling the truth.
The gap between them is a gap in position, and position is decided before a dollar is advanced. Part one of this series set out what first mortgage, second mortgage and mezzanine mean. This piece is about how you work out which one you are holding, and what the last three months of market data say about the buffer underneath it.
Why your fact sheet cannot answer this question
A typical private credit fact sheet gives you a distribution rate, a weighted average LVR, a number of loans, a geographic split and a sector split. Every one of those is backward-looking. None of them tells you how far the value of the underlying property has to fall before your capital is impaired.
That figure has a name in structured credit. It is the attachment point, and it is the percentage of asset value that must be lost before your position starts absorbing losses. Institutional investors in securitisation have priced off attachment points for decades. In Australian retail private credit the number is almost never published, and in a good many funds it is not calculated in a form an investor could use.
The arithmetic is not difficult. A first-ranking loan at a 65% loan-to-value ratio has a 35% attachment point, meaning roughly 35% of the underlying value has to evaporate before principal is touched. A second mortgage sitting behind a first, where the two together reach 75% of value, has a 25% attachment point. A mezzanine position taking the stack to 80% has 20%. The whole exercise is one subtraction, and it gives you a number you can compare against something real.
Three things distort it, and all three are working against investors right now.
The first is the valuation basis. An as-if-complete valuation on a development is an estimate of what the finished product will be worth in a market that has not happened yet. An as-is valuation is what a part-built site would fetch today. Measuring a 65% LVR against the first of those is a very different proposition from measuring it against the second, and the gap between the two widens as the market softens.
The second is prior-ranking debt. If a fund reports LVR on its own loan without counting the debt ranking ahead of it, the figure describes a position that does not exist. ASIC has been direct about this. In the commission's review of the sector, Simone Constant described canyon-wide variations in mission-critical definitions across managers, with LVR calculations that in some cases rest on incomplete construction-period valuations.
The third is that a blended LVR across first and subordinated positions averages a safe position and a thin one into a figure describing neither. Ask for them separately, weighted by drawn balance. A manager who cannot split them does not hold loan-level data in a usable form, which is itself worth knowing.
What the buffer is actually being tested against
Here is where the September data earns its place, because it tells you what a realistic fall now looks like rather than what a stress test assumes.
Cotality's October chart pack puts national dwelling values down 3.7% over the three months to September and flat over the year. Underneath the national figure the capital cities are doing the work, down 4.3% over the quarter against 1.9% for the regions. Sydney fell 4.9% over the quarter and 7.0% over the year, and now sits 8.6% below its February 2026 peak. Melbourne is 7.5% below a peak set back in March 2022. Brisbane and Perth, which were still posting double-digit annual growth not long ago, are now 5.4% and 6.0% below peaks set in May and April of this year.
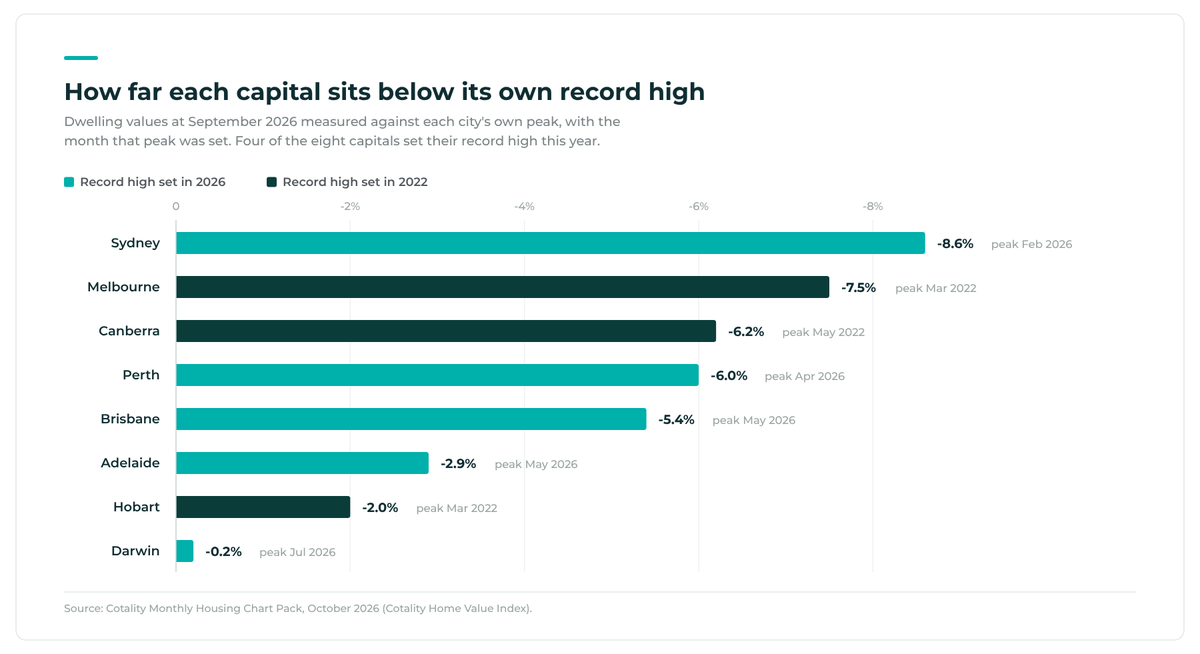
Figure 03. Four of the eight capitals set their record high this year. Those are the markets where the buffer is being consumed fastest.
Hold those peak-to-current numbers against the attachment points above. A mezzanine position with a 20% buffer is not close to impairment on a 6% fall. The point is the direction and the speed. Brisbane went from a record high to 5.4% below it inside four months. The buffer is being consumed from a market that was, until recently, the one everybody pointed to as the reason development lending in south-east Queensland was safe.
The stratified index adds something the headline hides. Over the September quarter, Sydney's most expensive quarter of housing fell 5.6% while the cheapest quarter fell 2.5%. In Brisbane the pattern inverts, with the lowest quartile down 4.3% and the middle down 5.0%. Perth's bottom and middle quartiles both fell 4.8%. For a lender this matters because a development's exit sits in a particular price band, and the band moved differently from the city average. A security valued off a city-wide index is being valued off the wrong number.
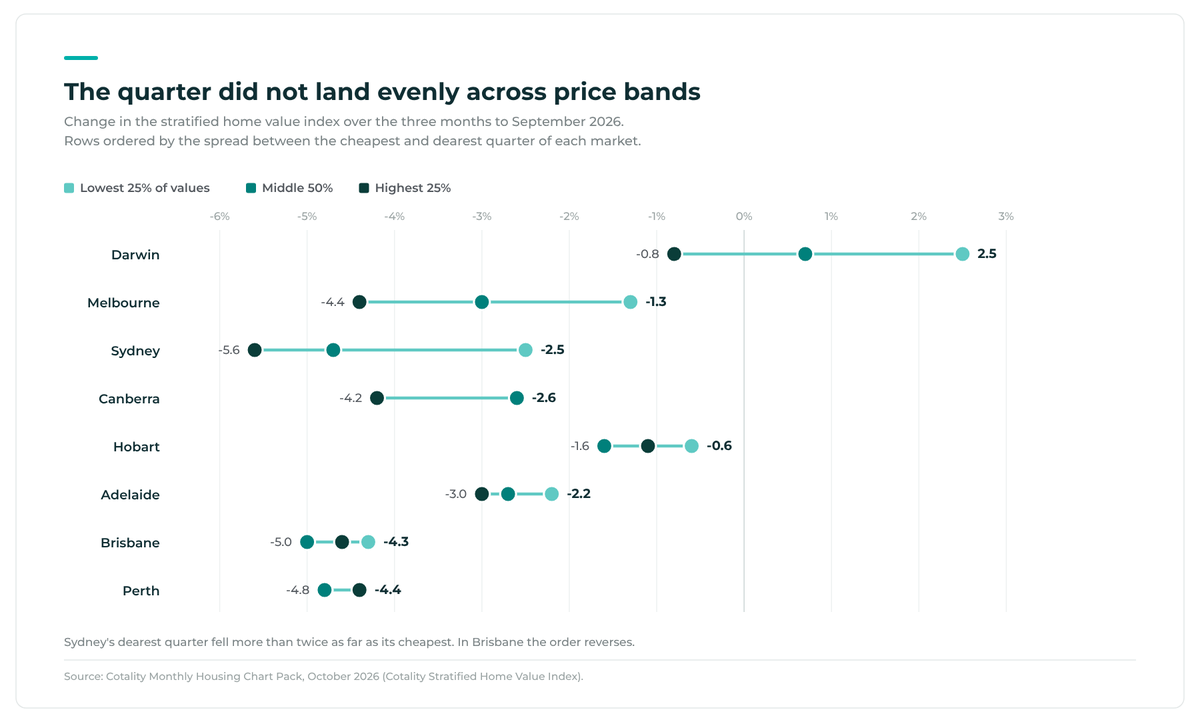
Figure 04. Sydney's most expensive quarter fell more than twice as far as its cheapest. In Brisbane the order reverses.
The other half of the buffer is time
Price is the half everyone reads. For a development loan the more dangerous variable is how long the exit takes, because interest accrues every day the asset is unsold and that accrual sits ahead of the junior positions in the waterfall.
The median time on market across the combined capitals reached 39 days over the three months to September, up from 23 a year earlier and the longest in the five-year series. Nationally it went from 26 days to 41. The median vendor discount in the capitals widened to 4.4%, also the widest in the series. The four-week average auction clearance rate was 48.3% at the start of October against 64.4% in late February, and the most recent weekly result was 45.4% across 1,212 auctions. Cotality estimates 39,747 sales nationally in September, 20.9% fewer than a year earlier and the ninth consecutive month below the prior year.
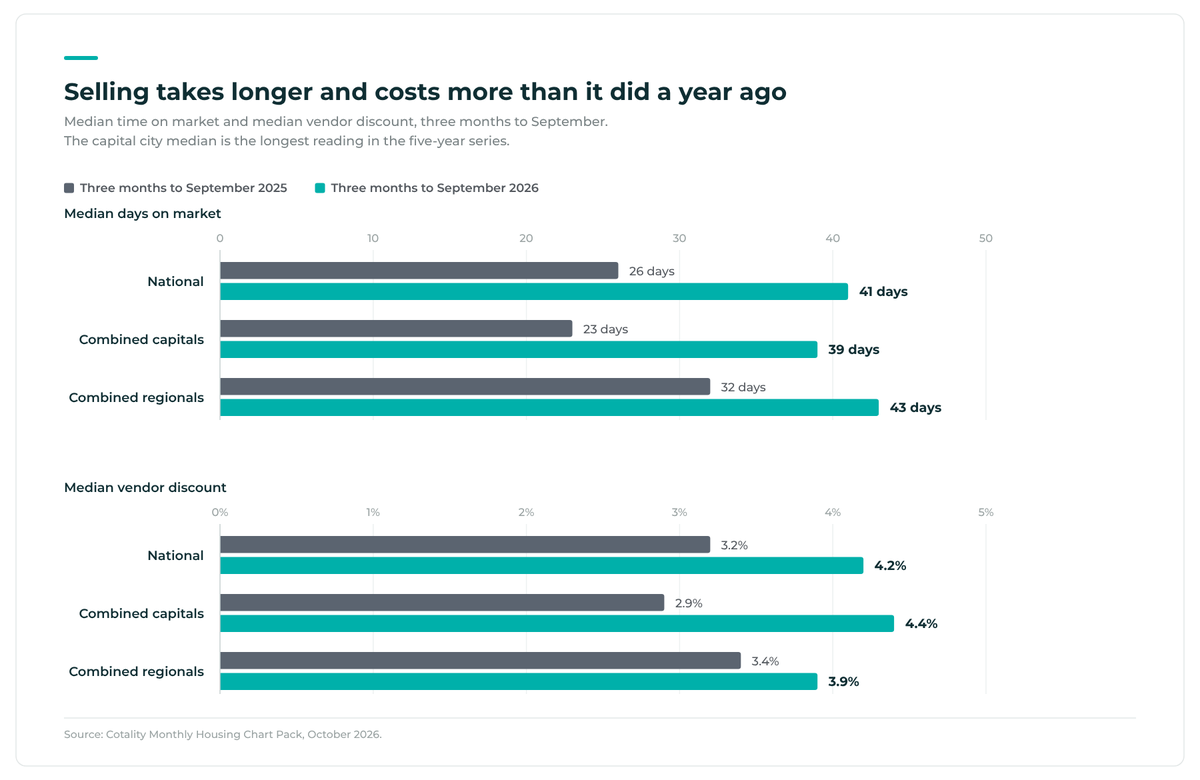
Figure 05. The capital city median went from 23 days to 39, the longest in the five-year series, while the discount needed to close widened to 4.4%.
Then the pair of figures that make the case. Total listings over the four weeks to 11 October reached 145,573, up 19.1% on a year ago. New listings over the same window were 36,440, down 7.9% and 11.9% below the five-year average. Fewer properties are coming to market and more are sitting on it. Stock is accumulating because it is not selling. Perth total listings are up 64.7% and Brisbane 60.4%, the two cities that led the country twelve months ago.
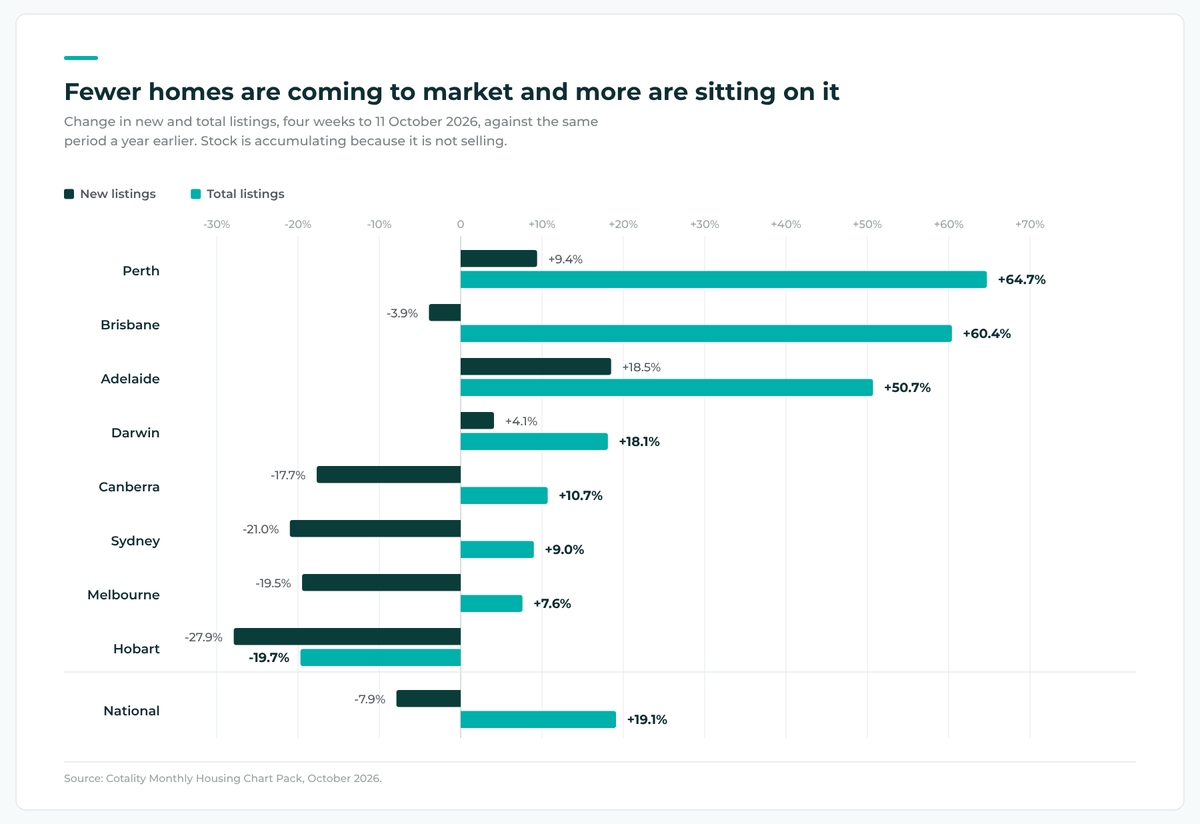
Figure 06. New listings below zero with total listings well above them is stock accumulating because it is not selling.
Every one of those numbers is a sell-down assumption that has moved against a feasibility written in 2024.
How delay moves money up the stack
This is the mechanic that gets missed, and it needs no invented example to show.
Interest does not stop when a borrower does. It keeps accruing on the senior facility right through a workout, and it ranks where the principal ranks, which is ahead of everything below it. What reaches the junior positions is whatever the asset realises once the senior claim has been met in full, and that claim keeps growing while the file sits. Nothing further has to go wrong for the junior lender's share to shrink. The calendar does it on its own.
Put a real duration on it. Bathla Group entered voluntary administration in August 2026, and in September the Federal Court extended the administration until September 2027 so existing projects could progress. That is a workout clock of roughly thirteen months already granted, on a group with around $3.4 billion of claims and some forty lenders. Thirteen months is more than a full year of senior interest added to the claim that ranks first, whatever rate the facility carries.
For the senior lender that extension is close to neutral, because the interest accrues to them and the extra time improves the odds of a completed sale. For anyone sitting behind the senior lender it is a continuous transfer of value out of their position, running at the senior rate, every day, while the file looks dormant from the outside. Two lenders can read the same court order and reach opposite conclusions about whether it is good news, and both are right.
Administrators' reports on that group have also found roughly $736 million in overstated intercompany receivables and bank accounts that had not been reconciled for some time. Nobody will know the recovery pattern for years. It will sort itself by ranking before it sorts itself by anything else.
We have watched this before
Australian mortgage funds went through this sequence between 2008 and 2011. The funds that returned capital in full were overwhelmingly those lending first-ranking against completed, income-producing property. The funds that lent into development, and especially those lending behind another lender, returned fractions. The industry filed that period under liquidity. It was a ranking event wearing a liquidity costume, and the redemption freezes were the symptom rather than the disease.
The construction cost picture is worse now than it was then. House construction costs sit 51% above pre-COVID levels, which means the cost to complete a stalled project is higher relative to its end value than it was in the last cycle, and the cost to complete is exactly what a receiver has to fund before anybody gets paid.
What this means for Australian investors
Immediately, the arithmetic above is already running on books written in 2023 and 2024. A loan underwritten on a six-month sell-down is now selling into a market clearing under half its auctions, with the median vendor conceding 4.4%. That does not produce losses on day one. It produces extensions, and extensions are where the junior positions bleed.
Through the next few quarters, expect the gap between funds to widen rather than narrow, and expect it to widen along ranking lines rather than along manager-quality lines. Two competent managers with identical processes will report very different outcomes if one sits first and one sits second.
Potentially, the thing to watch is the interaction between falling values and lengthening workouts, because they compound. A 6% fall absorbed over three months is a different event from the same fall absorbed over eighteen, and only the second one eats the buffer twice.
For private credit as a category, none of this is an argument against the asset class. It is an argument that the category contains positions with materially different loss behaviour, and that the differences are knowable before you invest rather than after.
What to do about it
Convert your holding into an attachment point and write the number down
Ask the manager for three things: the weighted average LVR, the valuation basis it is struck on, and whether debt ranking ahead of the fund is included in the calculation. All three are reasonable asks and none requires the manager to disclose anything confidential. With them you can produce the buffer yourself.
Then do the part almost nobody does, which is to compare it to something real. Take the peak-to-current fall in the city where the fund lends, take the quarterly fall in the relevant price quartile rather than the city average, and ask how much of your buffer this year has already used. For a position with 20% underneath it in a market 8.6% off its peak, the honest answer is that nearly half the cushion went in eight months.
Ask the time questions, because they decide the outcome more than the ratios do
How are development drawdowns released, and against what evidence. Whether an independent quantity surveyor signs off on construction progress before money moves. How often valuations are refreshed, whether there is a trigger obliging a revaluation when the manager forms a view that value may have fallen, and whether valuers are rotated so the same firm is not marking its own homework across a decade of a relationship.
These sound operational. They are the difference between a receiver holding a part-built asset with a known cost to complete and a receiver holding an unquantified problem. A lender who funded in stages against verified progress knows what they are sitting on. A lender who advanced against the borrower's own invoices often does not, and the Bathla reconciliation findings are a reminder that a borrower's own numbers are not evidence. Both lenders will describe themselves as secured.
Non-answers are data. A manager with loan-level systems can produce ranking, valuation basis and attachment point quickly. A marketing document in reply, or a delay of weeks, tells you something about the operational discipline behind the portfolio.
Match the position to the job you gave the money
The defensive part of a portfolio exists to hold its value and keep paying when the growth assets are having a poor year. Subordinated credit fails that test by construction, because its losses arrive in precisely the conditions the defensive allocation was meant to survive. Owning a mezzanine position is a legitimate choice. Counting it as defensive is a category error, and it is the most common one in Australian portfolios right now.
This is not an argument for retreating to cash. The 10-year government bond at 5.31% in September, its highest since 2011, carries its own unlabelled risk, as anyone who bought long-dated paper when the series averaged 0.80% in October 2020 has found out. The case for actively managed fixed income rests on the lending policy doing work a passive holding cannot, and ranking discipline is the largest single component of that work. Skyring's comparison of government bonds, corporate bonds and secured lending sets out how the sleeves behave against each other.
The bottom line
The question in the title has a real answer and you can reach it in an afternoon with the offer document and a calculator. Find your ranking. Find the valuation basis. Subtract to get the buffer. Then compare that buffer to the fall the relevant market has already delivered, and ask how long the manager's recovery process takes and what it costs while it runs. Those few numbers describe your risk considerably better than the distribution rate does.
The uncomfortable part is that none of this is about bad managers. A mezzanine lender who loses money in a downturn has not made a mistake. They took a position, and the position performed the way a position of that kind performs. The only real error would have been not knowing which position it was.
FAQ
What is an attachment point?
The percentage of the underlying asset's value that has to be lost before your position begins absorbing losses. A first mortgage at 60% LVR has a 40% attachment point, before accounting for accrued interest and enforcement costs.
Why does accrued interest matter if my loan is well secured?
Because the buffer is consumed from both ends. The asset's value falls from above while the debt grows from below as unpaid interest and enforcement costs accumulate. A position that looked comfortable when the loan was written can be thin by the time an asset is realised, without the property having fallen anywhere near the original buffer.
How much difference does the length of a workout make?
A great deal, and it falls on the junior positions. Senior interest keeps accruing through the workout and ranks ahead of everything below it, so the junior share shrinks with time alone. The Bathla administration has already been extended to September 2027, which is more than a year of senior accrual added to the claim that ranks first.
Is a blended LVR across first and second mortgages useful?
Not really. It averages positions with very different loss behaviour into a number that describes neither accurately. Ask for them reported separately, weighted by drawn balance.
What is the difference between an as-is and an as-if-complete valuation?
As-is is what the property would fetch in its current state today. As-if-complete is an estimate of the finished product's value in a future market. A development loan measured only against the second figure has a buffer that depends on a market that has not happened yet.
What is a quantity surveyor report and why does it matter?
An independent assessment of construction progress and remaining cost to complete. Lenders who release funds in stages against these reports know what they are holding if the builder fails. Lenders who advance against the borrower's own invoices often do not.
Does falling property value automatically mean losses for credit investors?
No. A first-ranking position with a substantial buffer can absorb a significant fall without principal impairment. What falling values do is shorten the distance to impairment and lengthen the time it takes to realise security, and the second of those is what tends to do the damage.
Does any of this mean private credit is a poor investment?
No. It means the category contains positions with materially different risk, and that the differences are knowable in advance. The work is in identifying which one you hold.
What should I do if my fund will not answer these questions?
Treat the non-answer as information. Ranking, valuation basis and prior-ranking debt are not commercially sensitive, and a manager with proper systems can produce them quickly.
References
Cotality, Monthly Housing Chart Pack, October 2026 (RP Data Pty Ltd t/as Cotality Asia Pacific), incorporating Cotality Home Value Index, Cotality Stratified Home Value Index and listings data to 11 October 2026.
Reserve Bank of Australia, Financial Stability Review, October 2026, 1 October 2026.
The Adviser, 'Beyond warning': ASIC tells private credit to expect enforcement action, 22 September 2026.
Business News Australia, Court extends Bathla Group administration for another year.
ABC News, Bathla Group reveals $3.4b debt as administrators warn some work could halt, 4 September 2026.
ABC News, Inside the mammoth task that could keep Bathla in administration for another year, 19 September 2026.
ABC News, Australia has a housing shortage. So why are Bathla and other home builders collapsing?, 8 September 2026.
YieldReport, Australian bond yields, 10 September 2026.
OECD via FRED, Interest Rates: Long-Term Government Bond Yields: 10-Year for Australia, monthly series.
Skyring Asset Management, First mortgage, second mortgage and mezzanine: what your ranking actually buys you, 25 September 2026.
Skyring Asset Management, Corporate Bonds vs Government Bonds vs Secured Lending, 26 May 2026.
Skyring Asset Management, What happened to Bathla?, 31 August 2026.
Important Information
This blog post is for general information only and does not consider your personal circumstances, financial needs, or objectives. You should read the Product Disclosure Statement carefully before investing. Past performance is not a reliable indicator of future results. Investments carry risks including possible loss of capital. No guarantee is made regarding the repayment of capital or the payment of income.
As with all investments, returns are subject to market conditions and the performance of the underlying assets.
This rate of return is subject to the performance of our related entity, Skyring Capital Pty Ltd and/or Skyring Securities Pty Ltd.
You should consider whether the investments are suitable for you or seek personal advice from a licensed financial planner before making an investment decision.
To invest in this Offer, investors should obtain and read the PDS, SPDS and TMD before making an investment decision. TMD, SPDS and PDS for this product are available from our website or request a copy by contacting us on 1300 73 72 74 or request one from your Financial Advisor. Investments may only be made by completing the application form attached to the Product Disclosure Statement or via our online application service.
Skyring Asset Management Limited ACN 156 533 041 holds Australian Financial Services License (AFSL) 422902. Skyring has registered the Skyring Fixed Income Fund ARSN 622 775 464 with the Australian Securities and Investments Commission (ASIC). Skyring Asset Management Limited ACN 156 533 041 AFSL 422902 is the issuer and manager of the Skyring Fixed Income Fund ARSN 622 775 464. Skyring has registered the Skyring Platinum Fixed Income Fund ARSN 646 317 982 with the Australian Securities and Investments Commission (ASIC). Skyring Asset Management Limited ACN 156 533 041 AFSL 422902 is the issuer and manager of the Skyring Platinum Fixed Income Fund ARSN 646 317 982.
Withdrawal rights are subject to liquidity and may be delayed or suspended. See PDS and SPDS for more information.
Skyring's address is Level 2, 2 Gardner Close, Milton, QLD, 4064. Our reply-paid postal address is Reply Paid 88076, Kenmore, QLD 4069. You can contact us by telephone on 1300 73 72 74 or via email at investor@skyring.com.au.